Posted on
July 12, 2026
by
Steve Davis
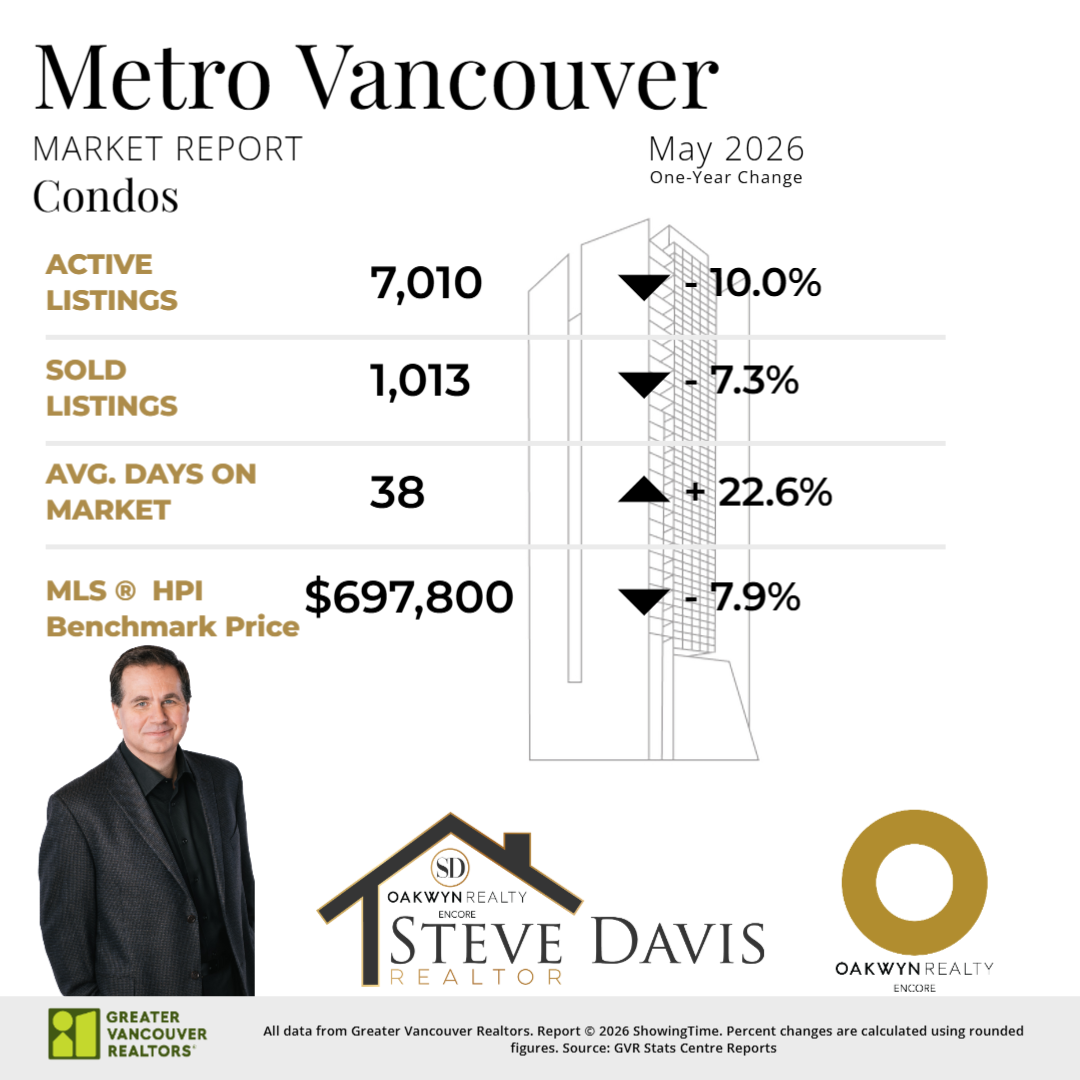
There were 5,938 detached, attached and apartment properties newly listed for sale on the Multiple Listing Service® (MLS®) in Metro Vancouver in June 2026. This represents a six per cent decrease compared to the 6,315 properties listed in June 2025. This was 5.9 per cent above the 10-year seasonal average (5,609).
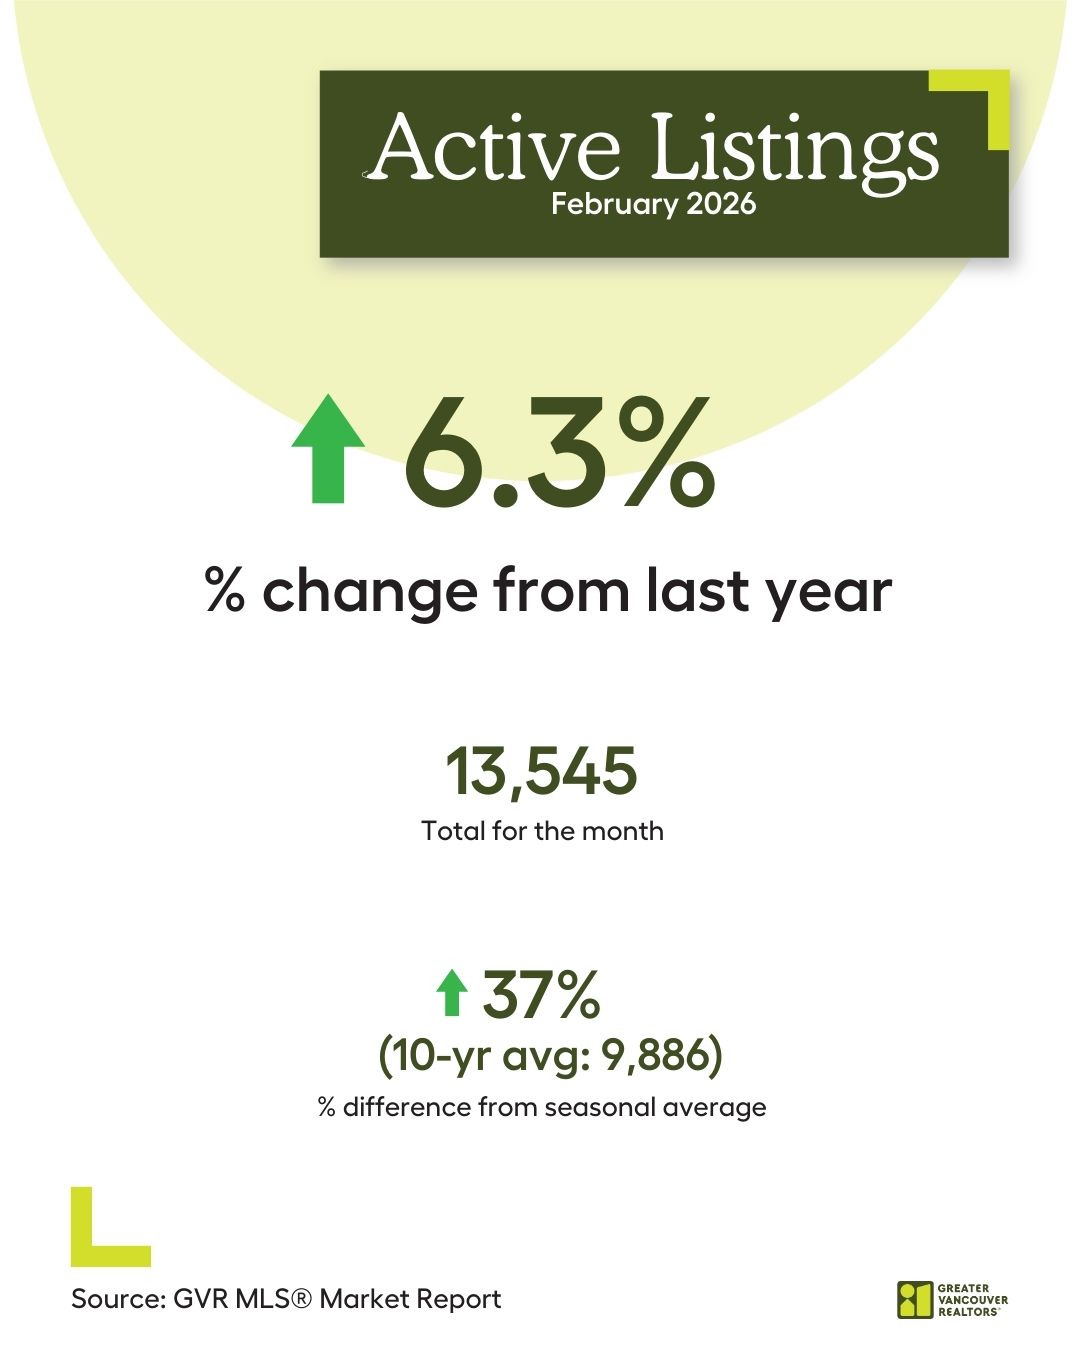
The total number of properties currently listed for sale on the MLS® system in Metro Vancouver is 17,017, a 3.1 per cent decrease compared to June 2025 (17,561). This is 30.2 per cent above the 10-year seasonal average (13,070).