
July 2026 brought softer year-over-year pricing across Metro Vancouver, with market conditions varying considerably depending on property type and location. Looking more closely at Burnaby South and New Westminster shows why local market statistics remain important when making a real estate decision.
Metro Vancouver
Across Metro Vancouver, benchmark prices were lower year-over-year for detached homes, condos and townhomes.
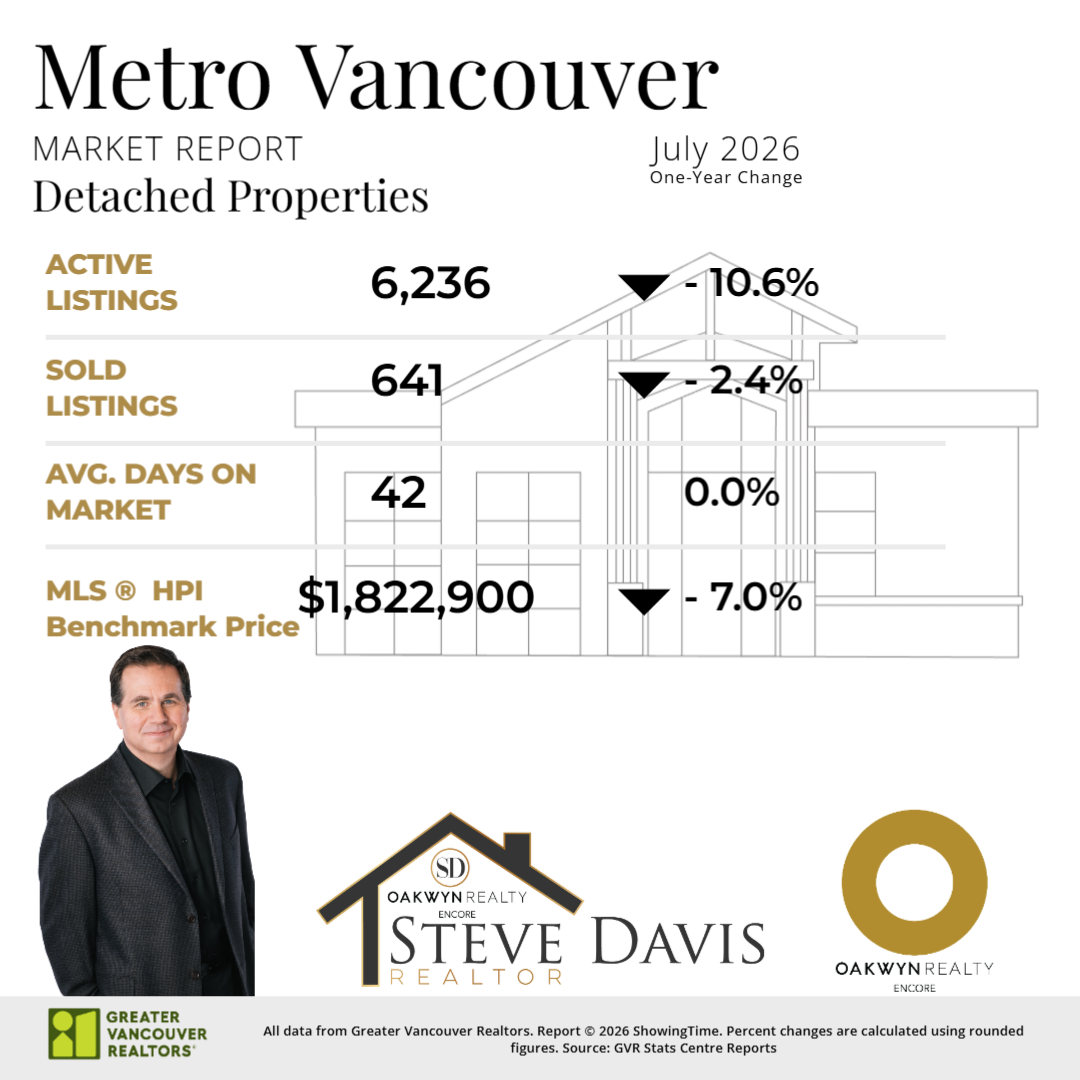
Detached homes recorded 641 sales in July, down 2.4 per cent from a year earlier, with 6,236 active listings. The average detached home spent 42 days on the market, unchanged from July 2025. The MLS® HPI benchmark price was $1,822,900, representing a 7.0 per cent year-over-year decrease.
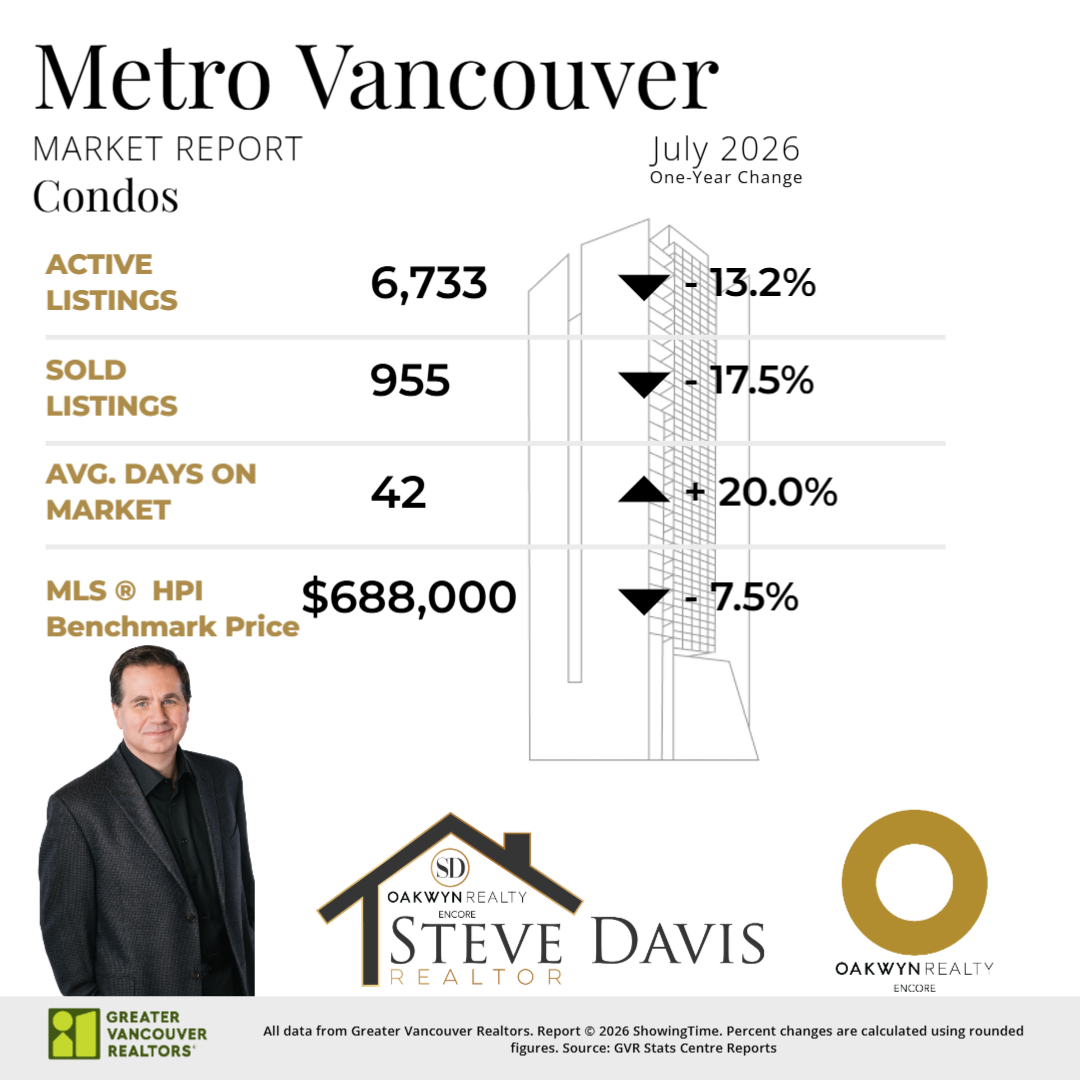
Condo sales totalled 955, down 17.5 per cent compared with July 2025. There were 6,733 active condo listings, while the average time on market increased 20 per cent to 42 days. The benchmark price was $688,000, down 7.5 per cent year-over-year.
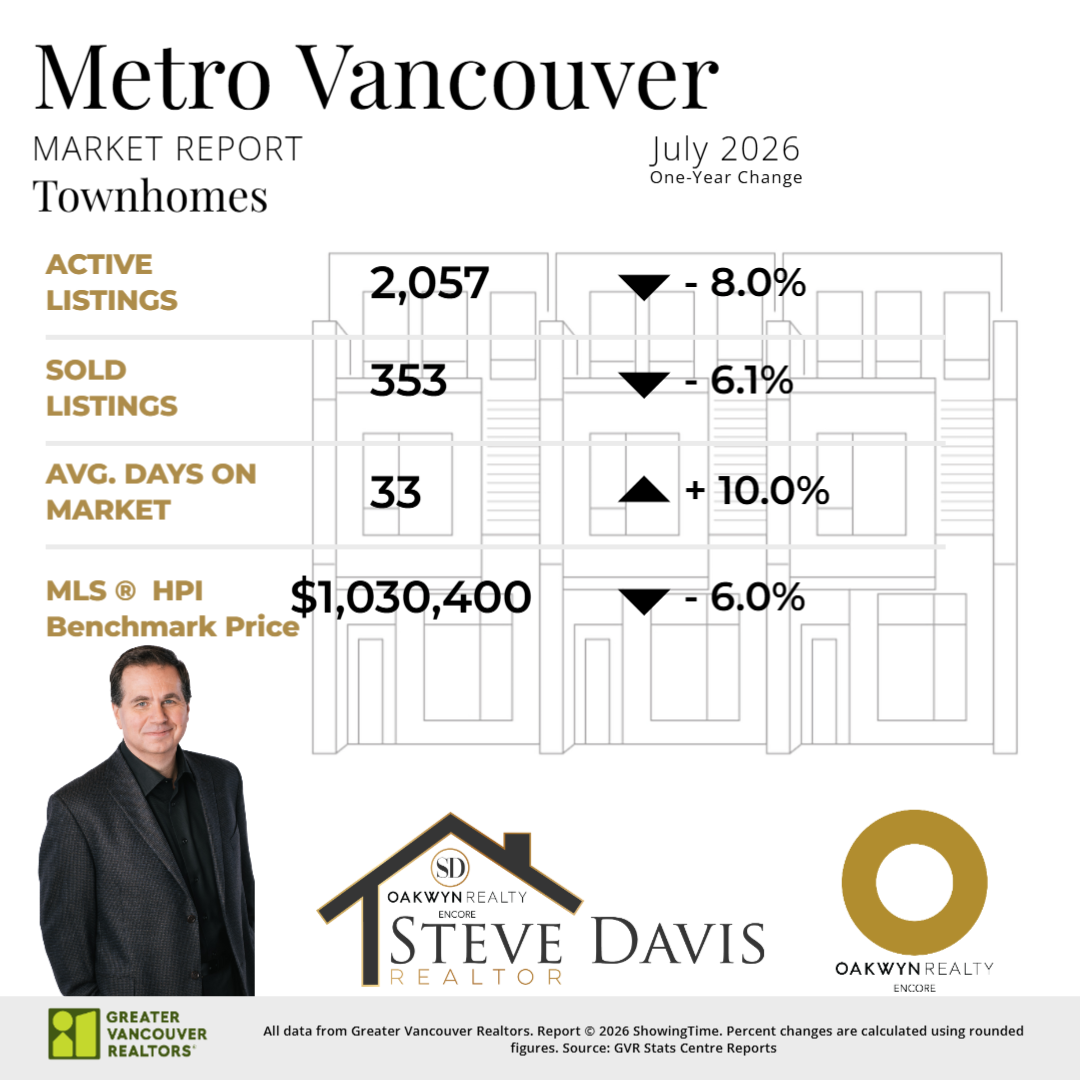
Townhomes recorded 353 sales, a 6.1 per cent decrease from last year, with 2,057 active listings. Townhomes spent an average of 33 days on the market, up 10 per cent year-over-year. The benchmark price was $1,030,400, down 6.0 per cent.
Burnaby South
Burnaby South experienced a mixed market in July, with sales activity varying substantially between property types.
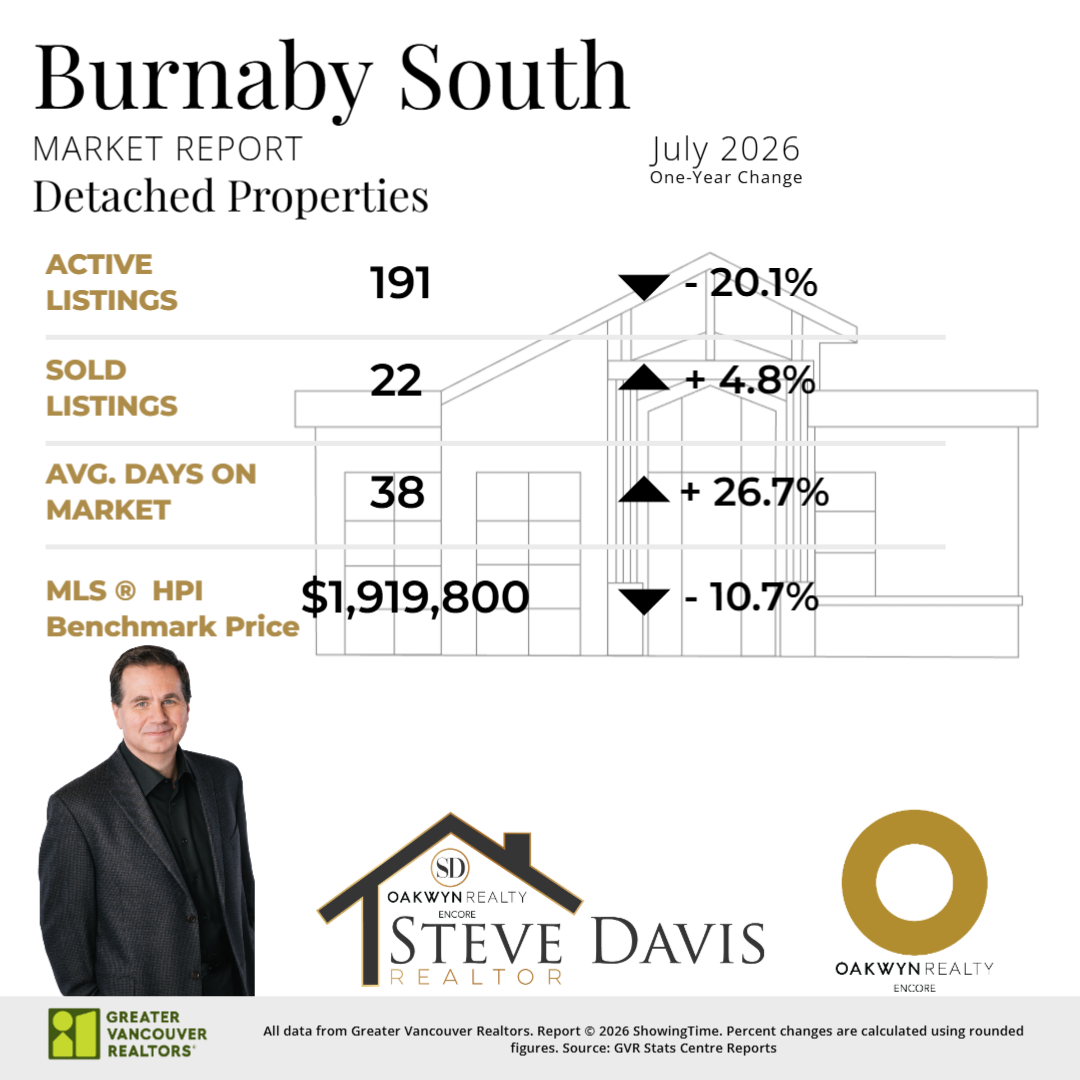
Detached homes recorded 22 sales, an increase of 4.8 per cent compared with July 2025, despite active listings declining 20.1 per cent to 191. The average time on market increased to 38 days. The benchmark price was $1,919,800, down 10.7 per cent year-over-year.
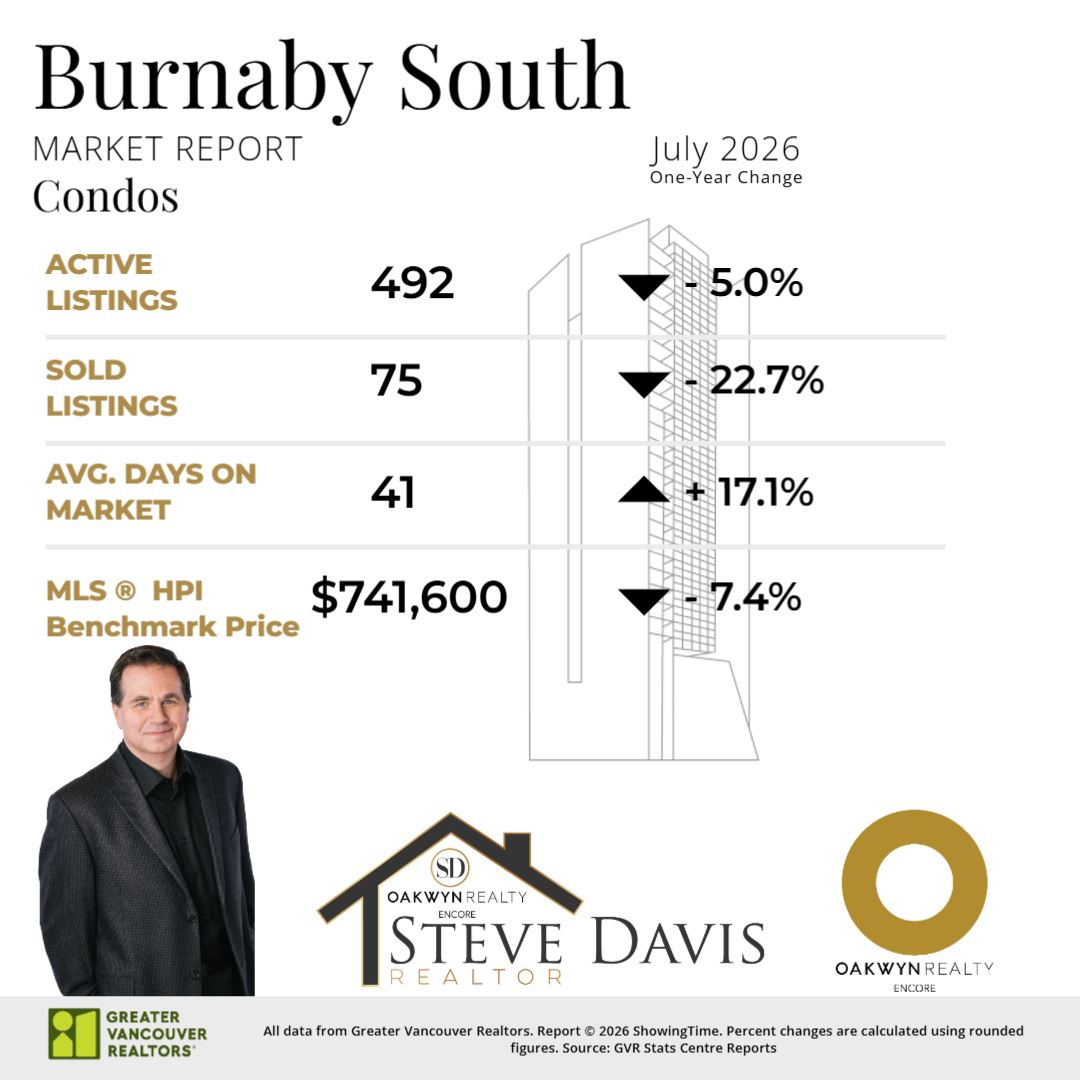
The condo market recorded 75 sales, down 22.7 per cent from last year, with 492 active listings. Condos spent an average of 41 days on the market, an increase of 17.1 per cent. The benchmark condo price was $741,600, down 7.4 per cent year-over-year.
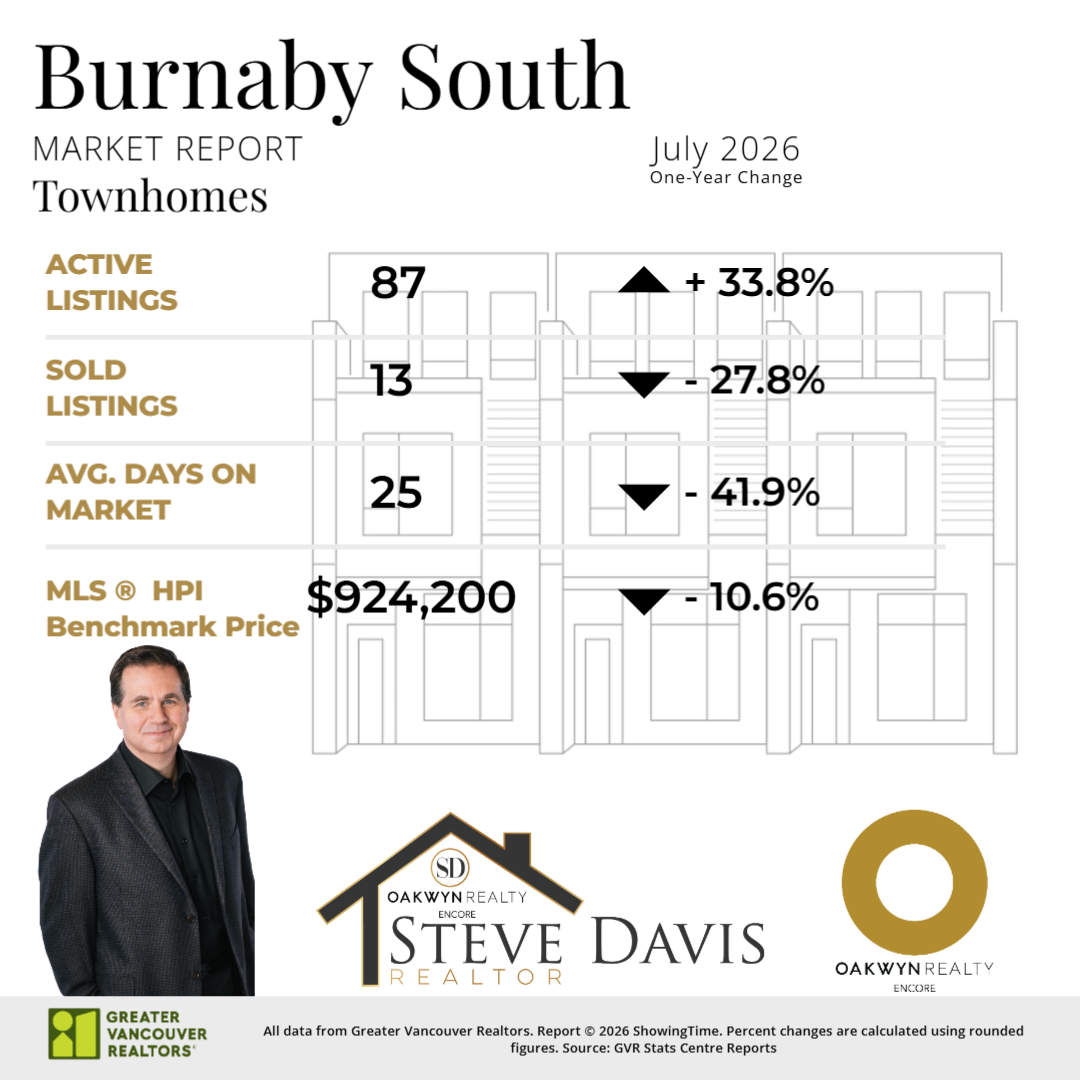
Burnaby South townhomes recorded 13 sales, down 27.8 per cent compared with July 2025. Active listings increased significantly, rising 33.8 per cent to 87. Interestingly, the average time on market declined to just 25 days. The benchmark townhouse price was $924,200, down 10.6 per cent year-over-year.
New Westminster
New Westminster also saw benchmark prices decline across all three property types in July.
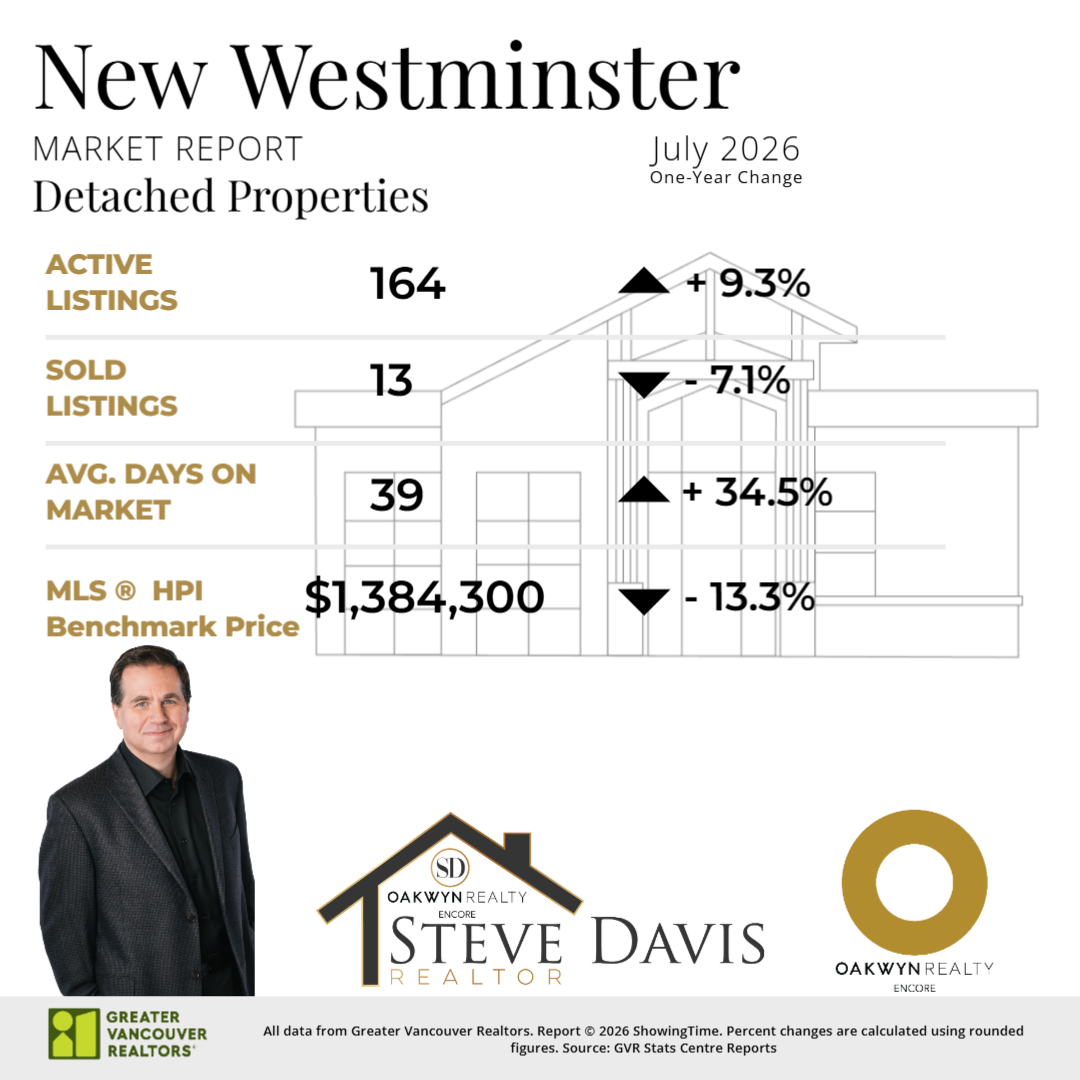
Detached homes recorded 13 sales, down 7.1 per cent year-over-year, while active listings increased 9.3 per cent to 164. The average time on market rose to 39 days. The benchmark price was $1,384,300, down 13.3 per cent compared with July 2025.
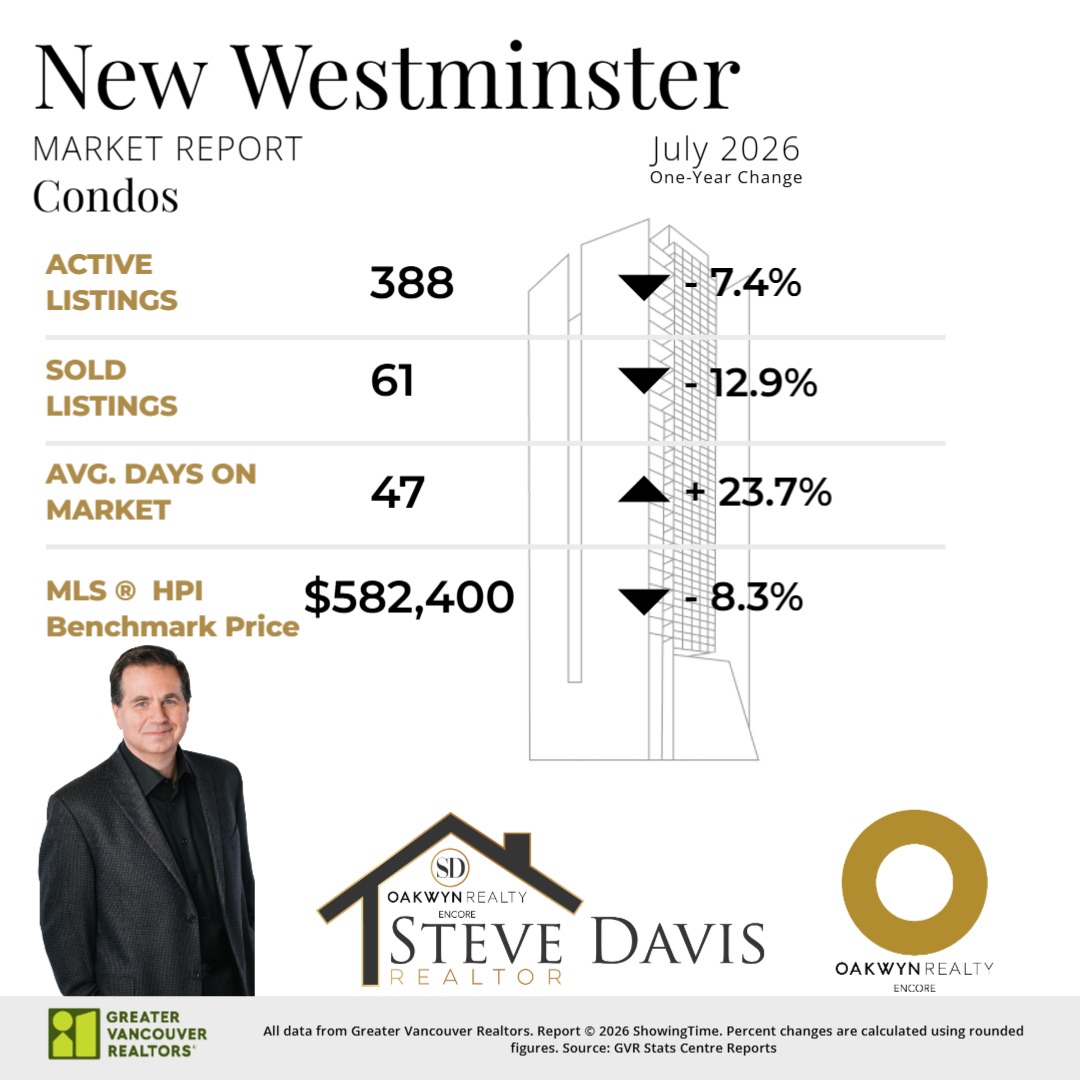
The condo market recorded 61 sales, a 12.9 per cent decrease from last year, with 388 active listings. Condos spent an average of 47 days on the market, up 23.7 per cent year-over-year. The benchmark condo price was $582,400, an 8.3 per cent decrease.
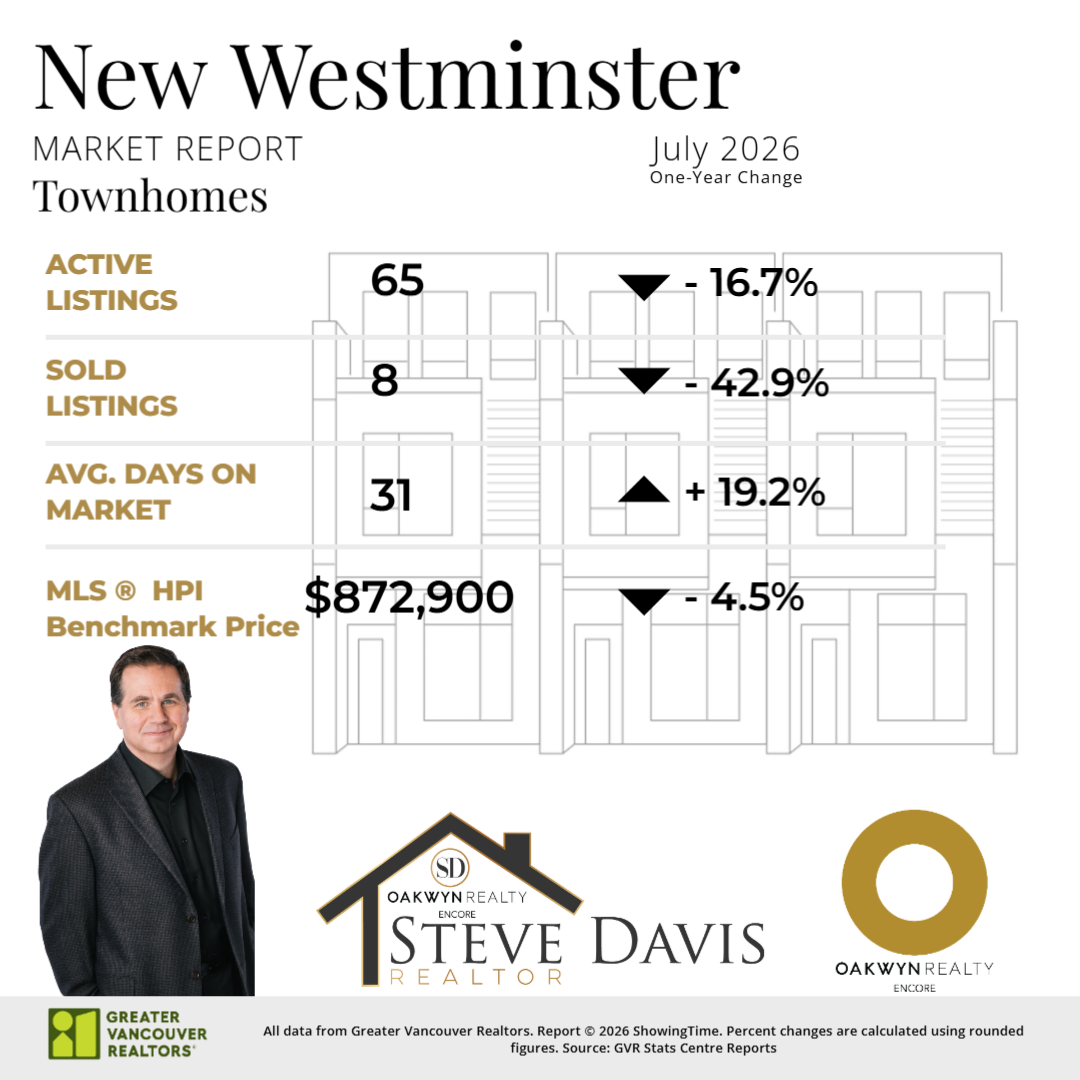
Townhomes recorded eight sales in July, down 42.9 per cent from a year earlier. There were 65 active listings, while the average time on market increased to 31 days. The benchmark townhouse price was $872,900, down 4.5 per cent year-over-year.
What Does This Mean for Buyers and Sellers?
July’s numbers continue to demonstrate that there is no single real estate market across Metro Vancouver. Conditions can differ significantly between detached homes, condos and townhomes, and even more when looking at individual communities such as Burnaby South and New Westminster.
For buyers, lower benchmark prices and longer marketing times in several segments may provide more opportunity to compare properties and negotiate. For sellers, accurate pricing and understanding the competition within your specific neighbourhood and property type remain especially important.
If you are considering buying or selling in Metro Vancouver, Burnaby South or New Westminster, I would be happy to discuss what the latest market numbers mean for your specific property and real estate goals.

 The data relating to real estate on this website comes in part from the MLS® Reciprocity program of either the Greater Vancouver REALTORS® (GVR), the Fraser Valley Real Estate Board (FVREB) or the Chilliwack and District Real Estate Board (CADREB). Real estate listings held by participating real estate firms are marked with the MLS® logo and detailed information about the listing includes the name of the listing agent. This representation is based in whole or part on data generated by either the GVR, the FVREB or the CADREB which assumes no responsibility for its accuracy. The materials contained on this page may not be reproduced without the express written consent of either the GVR, the FVREB or the CADREB.
Comments:
Post Your Comment: