

Are you considering selling your home this fall? September's real estate statistics reveal why understanding your local market is more important than ever.
Across Metro Vancouver, benchmark prices remain below last year's levels, but sales activity tells a more interesting story. Some property types are seeing renewed interest, inventory is declining in several areas, and buyers continue to purchase homes that meet their expectations.
For homeowners considering selling, the question isn't simply whether the market is up or down. It's how your particular property compares with the competition and what strategy will give it the best opportunity to sell.
Let's take a closer look at September 2026, including comparisons with August and September 2025.
Metro Vancouver: A Market That Rewards Preparation
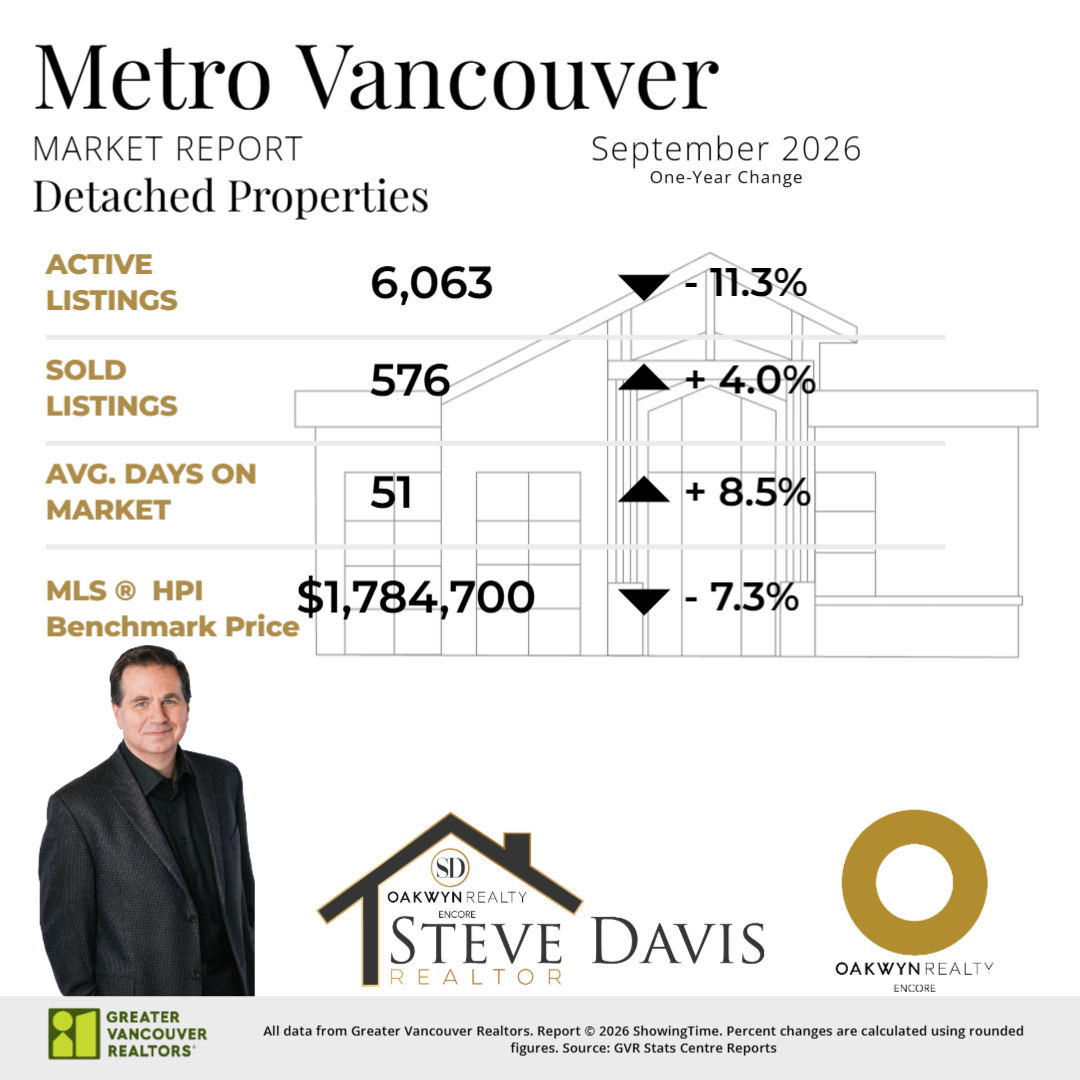
Across Metro Vancouver, September continued to show softer prices, although detached home sales improved.
Detached Homes
The benchmark price was $1,784,700, down 7.3% from September 2025 and 0.8% from August.
Sales reached 576 properties, up 4.0% year over year and 2.9% month over month. Active listings declined to 6,063, representing an 11.3% reduction from last year.
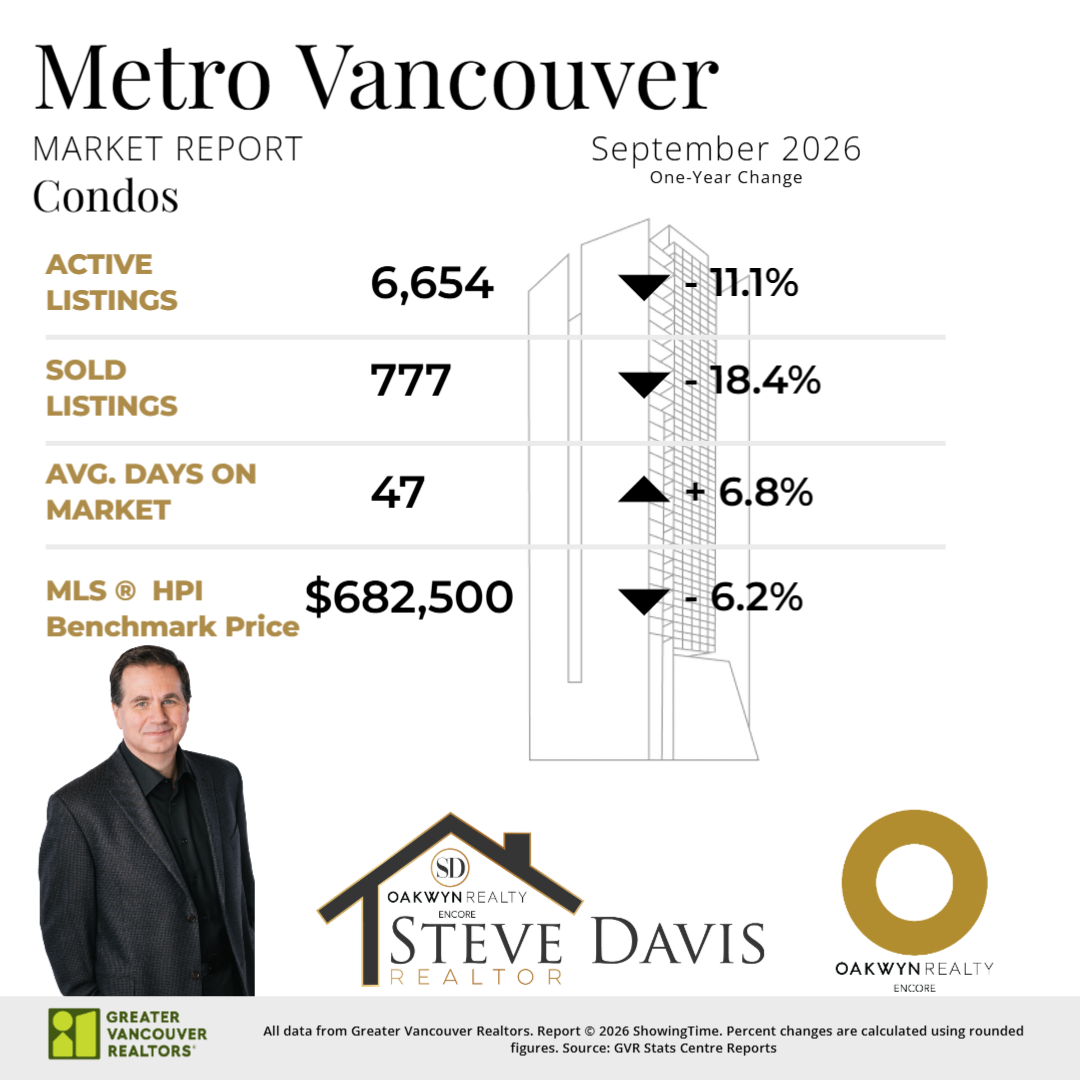
Condos
The benchmark price settled at $682,500, down 6.2% year over year and 0.5% from August.
Sales declined to 777 properties, an 18.4% annual decrease and a 12.9% drop from August. Active listings also declined, reaching 6,654.
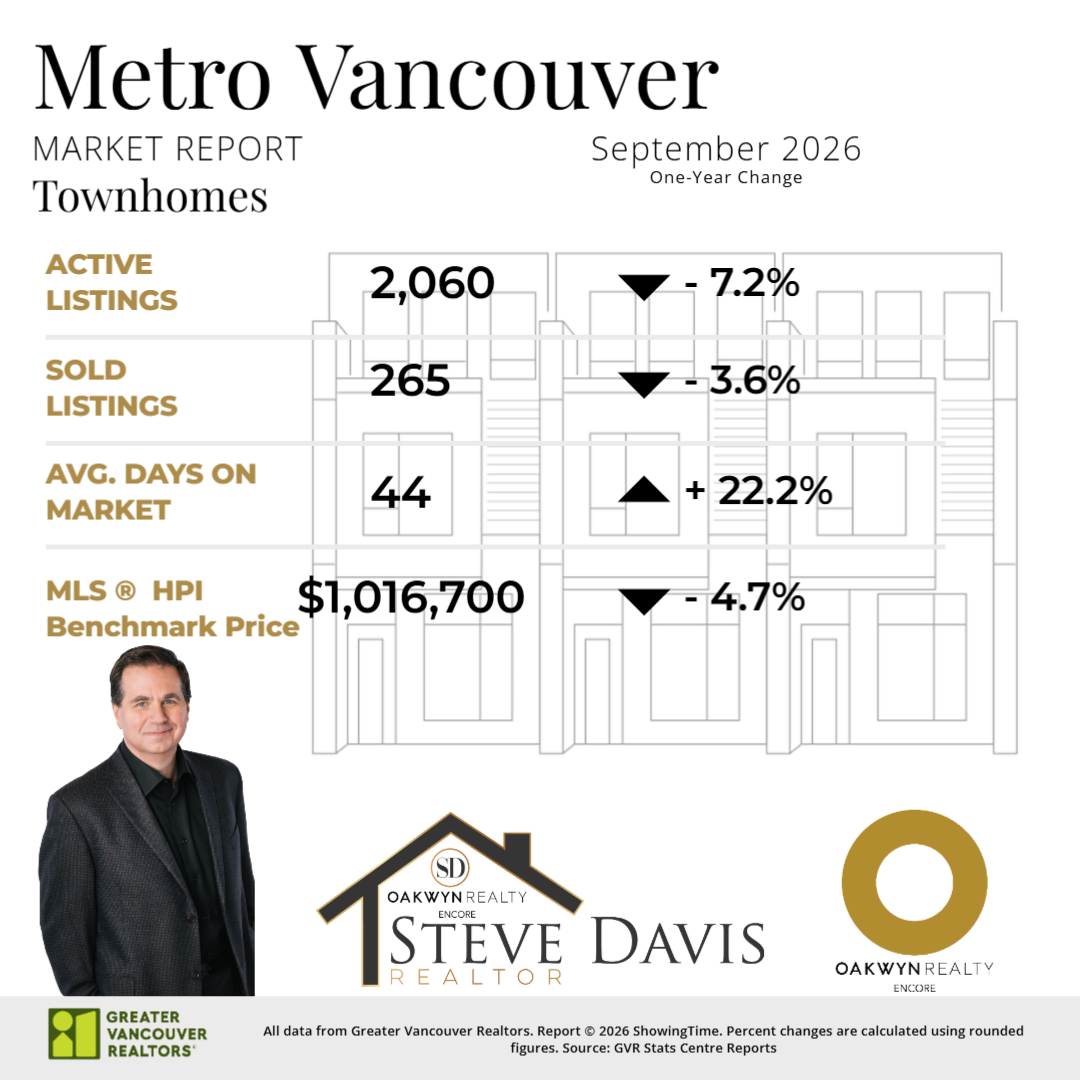
Townhomes
The benchmark price reached $1,016,700, down 4.7% annually and 1.2% from August.
Sales totalled 265 properties, down 3.6% year over year and 12.0% from August. Active listings increased slightly to 2,060 compared with August.
What does this mean for Metro Vancouver sellers?
Buyers remain active, but they're taking time to compare properties and evaluate value. Detached sales have shown some resilience, while condos and townhomes face slower activity.
For sellers, the first few weeks of a listing can be especially important. Entering the market with the right price, strong presentation, and an effective marketing plan helps a property compete for attention.
Burnaby South: Encouraging Activity for Detached Homes and Townhomes
Burnaby South experienced some notable improvements in September, particularly in detached homes and townhomes.
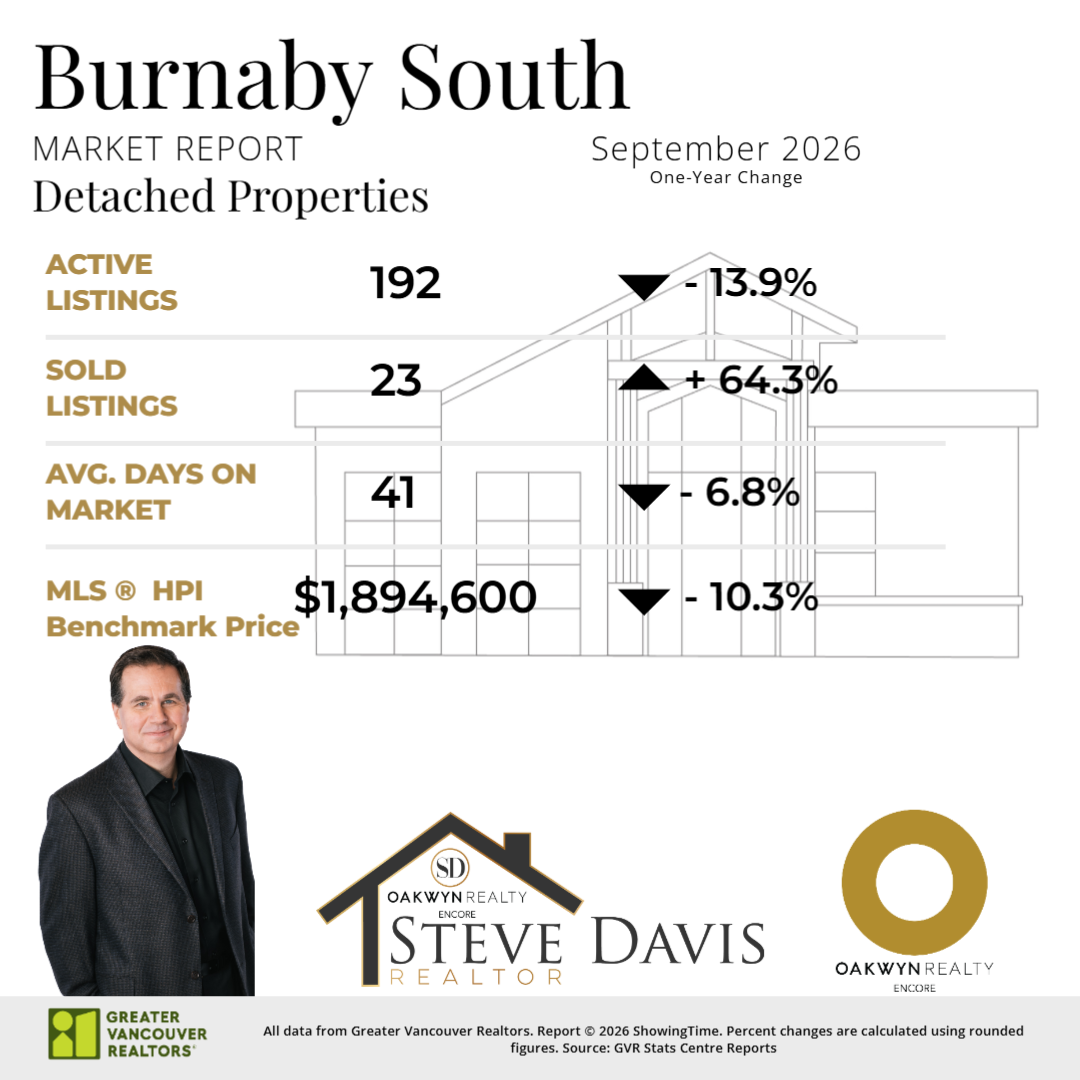
Detached Homes
The benchmark price was $1,894,600, down 10.3% year over year but increasing 0.4% from August.
Sales climbed to 23 properties, up 64.3% compared with September 2025 and 43.8% from August.
Active listings declined to 192, down 13.9% year over year. Average days on market also improved from 46 in August to 41 in September.
Condos
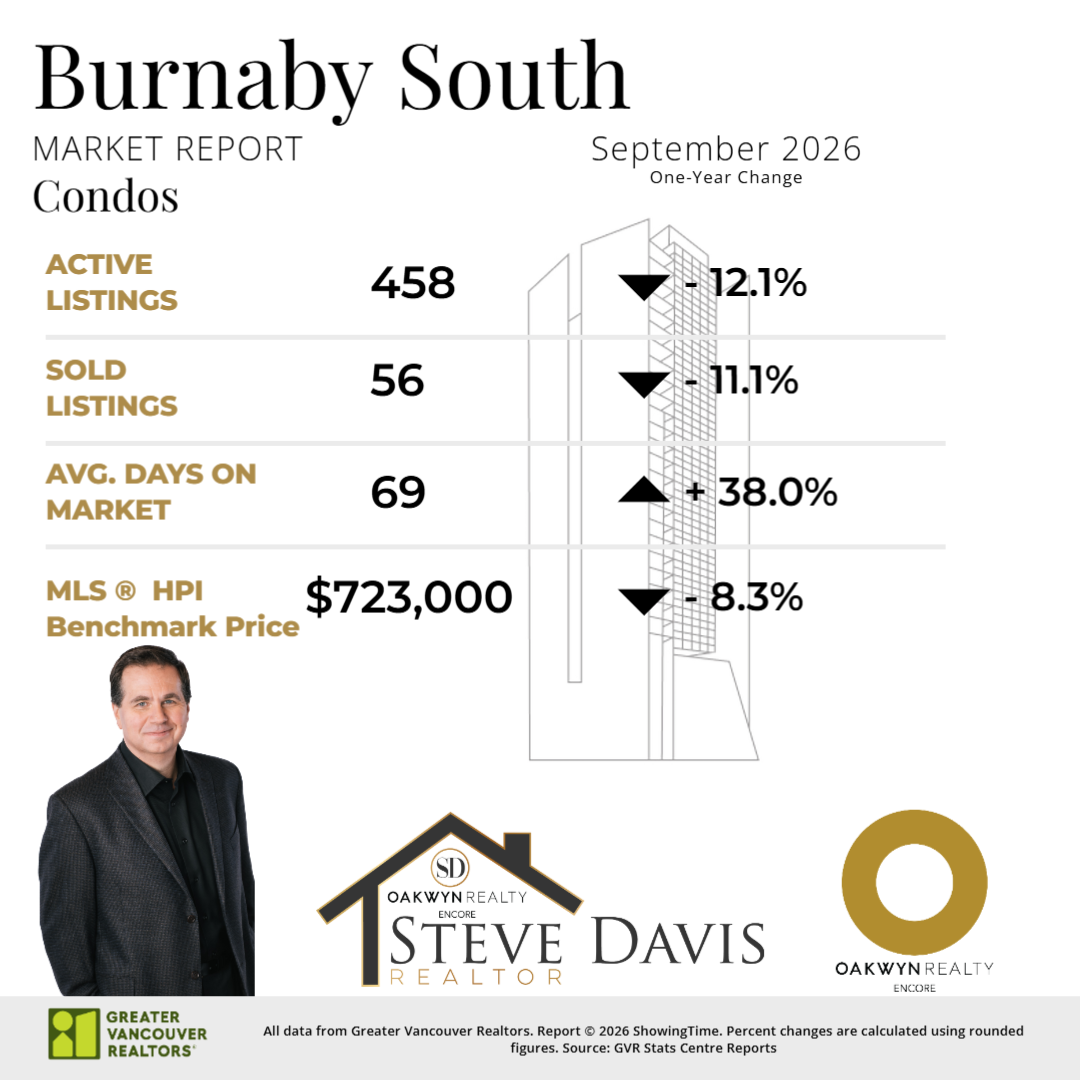
The benchmark price was $723,000, down 8.3% annually and 1.2% from August.
Sales declined to 56 properties, down 11.1% year over year and 25.3% month over month.
Although active listings decreased to 458, average selling times rose to 69 days, compared with 50 in August.
Townhomes
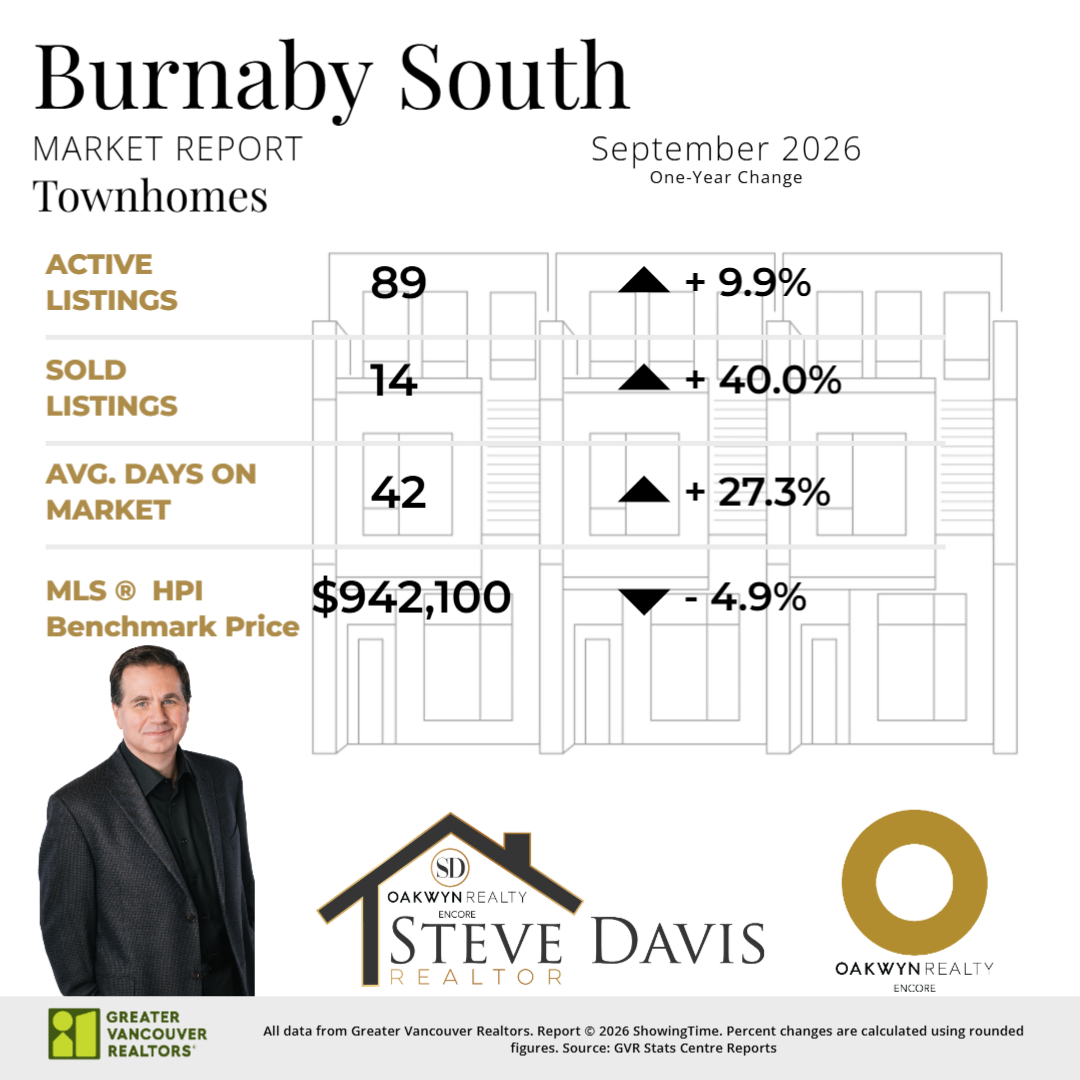
The benchmark price reached $942,100, down 4.9% annually but increasing 0.9% from August.
Townhome sales jumped to 14 properties, up 40% year over year and 133.3% from August.
Active listings remained unchanged at 89.
What does this mean for Burnaby South sellers?
For detached and townhome owners, the increase in sales activity is encouraging. Buyers are still making purchases, even in a market where benchmark prices remain below last year's levels.
Condo sellers face a different environment, with longer selling times and reduced sales activity.
Whether your property is in Metrotown, South Slope, Highgate, or another Burnaby South neighbourhood, understanding competing listings and recent comparable sales is essential before deciding on an asking price.
New Westminster: Different Opportunities Across Property Types
New Westminster's September market demonstrates why local statistics matter when planning a sale.
Detached Homes
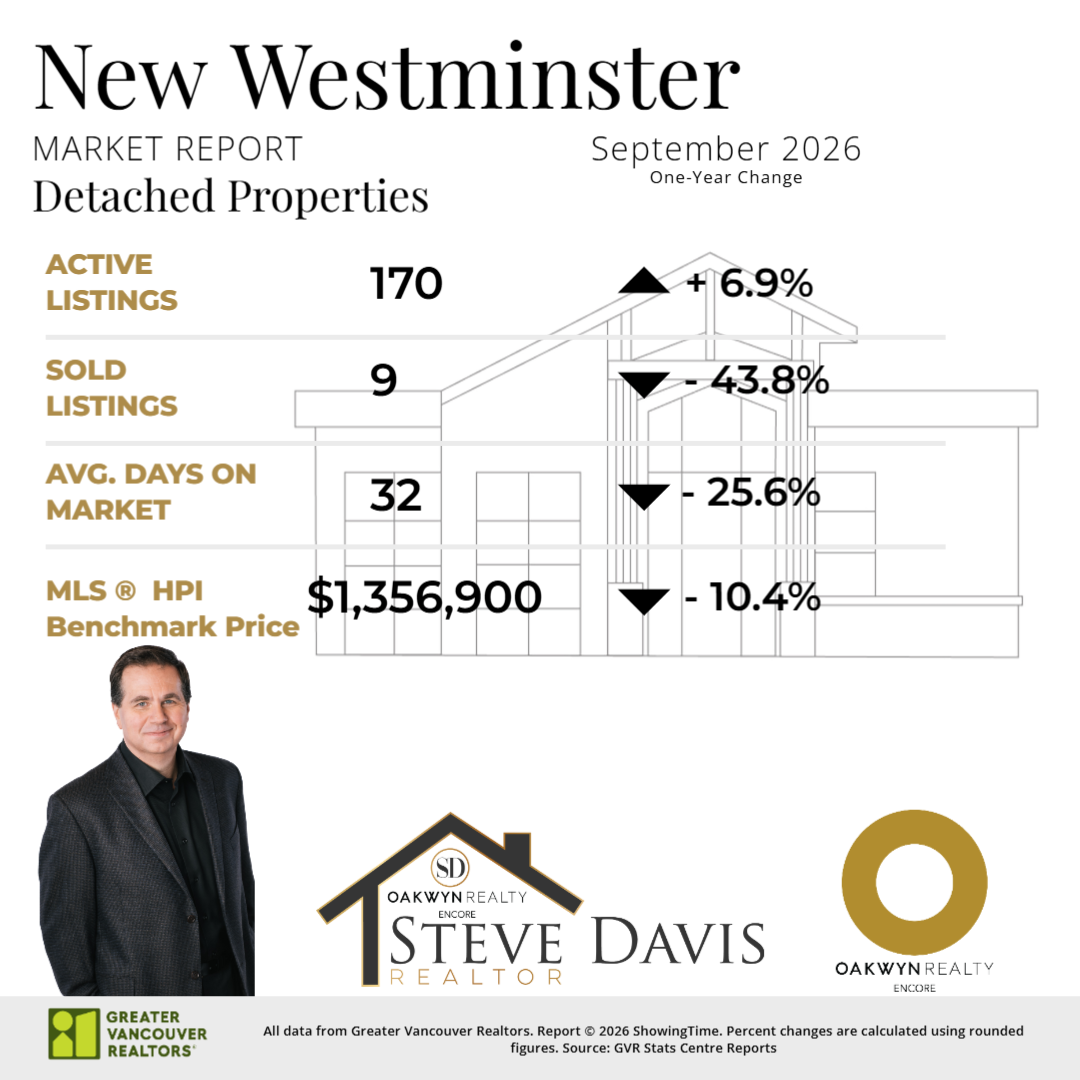
The benchmark price was $1,356,900, down 10.4% annually and 1.5% from August.
Sales declined to 9 properties, compared with 16 in August and 16 in September 2025 — a 43.8% decrease in both comparisons.
Active listings increased to 170, creating additional competition among sellers.
Condos
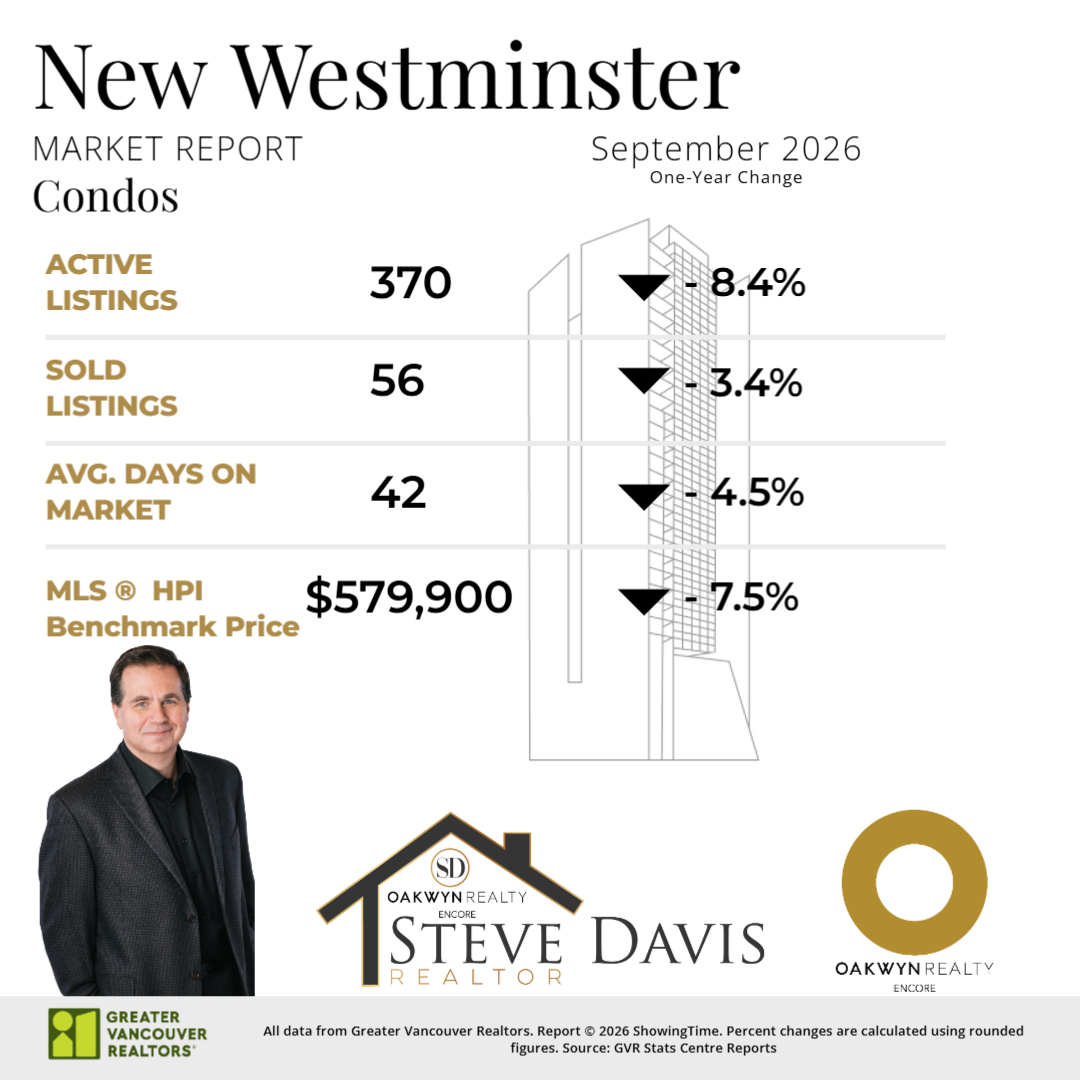
The benchmark price reached $579,900, down 7.5% year over year but increasing 0.7% from August.
Sales remained steady at 56 properties compared with August, while active listings declined 6.6% to 370.
Average days on market improved from 50 in August to 42 in September.
Townhomes
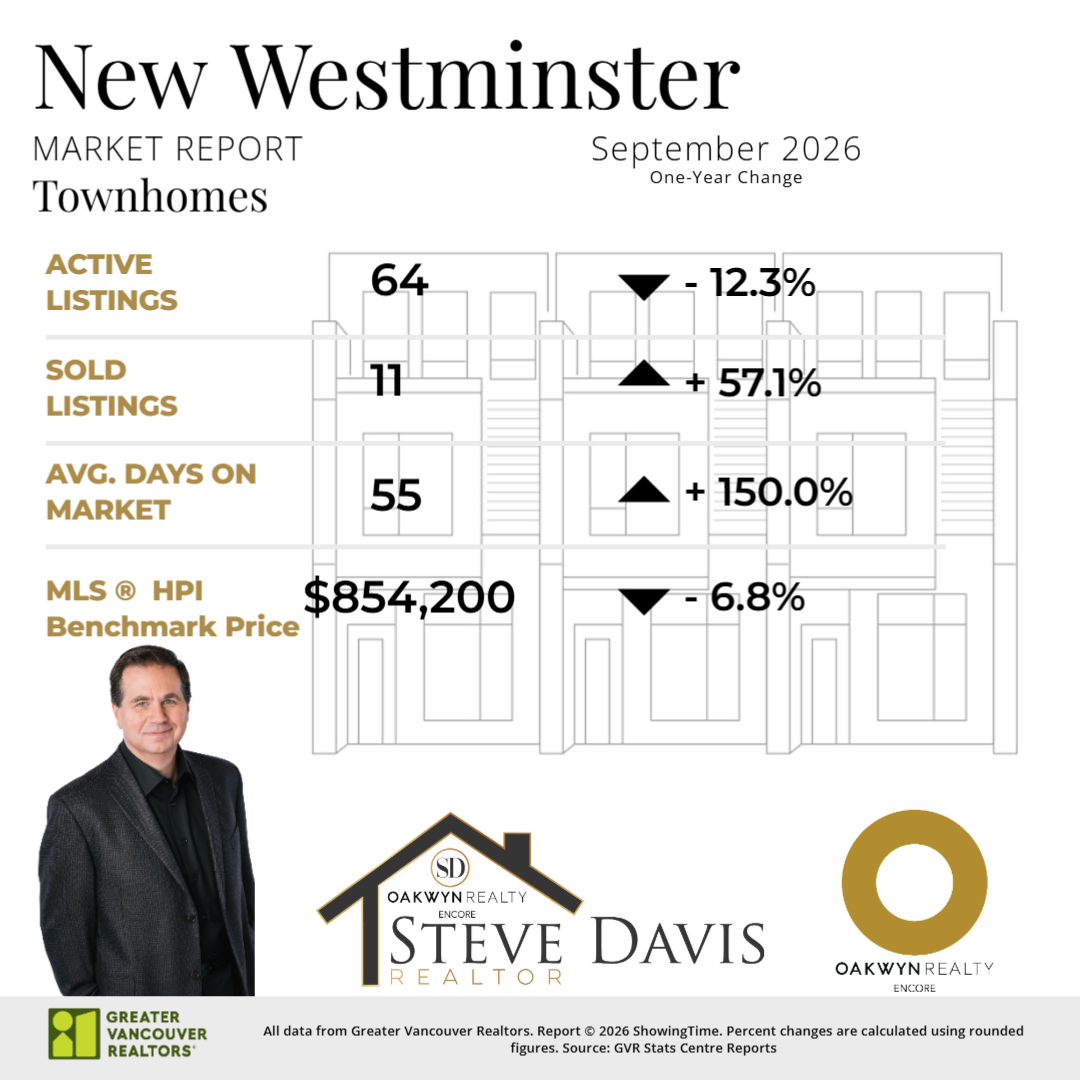
The benchmark price was $854,200, down 6.8% year over year and 2.2% from August.
However, sales more than doubled from August, increasing from 5 to 11 transactions. This represents a 120% month-over-month increase and a 57.1% annual increase.
Active listings declined to 64.
What does this mean for New Westminster sellers?
Condo owners saw some encouraging month-over-month improvements, including fewer competing listings, steady sales, and shorter selling times.
Townhomes also experienced stronger buyer activity, although average selling times remain elevated compared with last year.
Detached homeowners face greater competition and fewer transactions, making accurate pricing and effective marketing particularly important.
From Downtown and Uptown to Queensborough, Sapperton, and the Quay, each neighbourhood has its own market conditions that deserve careful consideration.
Five Things Sellers Should Consider Before Listing
September's statistics highlight an important reality: the market does not treat every home equally.
If you're considering selling, here are five things worth understanding before putting your property on the market.
1. Price for today's market, not yesterday's.
What a neighbouring property sold for one or two years ago may not reflect current market conditions. Recent comparable sales offer a more reliable starting point.
2. Understand your competition.
Buyers compare properties carefully. Knowing which similar homes are currently available helps determine how to position your listing.
3. Make your first impression count.
Professional photography, thoughtful presentation, and a well-prepared listing can help attract interest when buyers have multiple options.
4. Pay attention to local market trends.
Metro Vancouver statistics provide useful context, but your neighbourhood and property type may be performing quite differently.
5. Have a strategy before you list.
Selling successfully involves more than choosing a price. Timing, presentation, marketing, negotiations, and responsiveness to buyer feedback all play important roles.
Thinking About Selling? Let's Start With Your Home's Value.
Whether you're considering downsizing, relocating, moving to a larger home, or simply exploring your options, understanding your property's current market value is a great place to begin.
September's statistics show that opportunities still exist, but sellers need to be informed, realistic, and prepared.
Your home deserves a strategy based on its unique features, neighbourhood, and competition — not just the latest regional headline.
I'd be happy to provide a personalized market evaluation that considers recent comparable sales, current listings, and buyer activity in your area.
There's no obligation to list. It's simply an opportunity to understand where your property stands and what your options might look like.
Thinking about selling in Burnaby, New Westminster, or elsewhere in Metro Vancouver? Let's talk before you list.
Steve Davis, REALTOR®
Oakwyn Realty Encore
Source: Greater Vancouver REALTORS® — September 2026 REALTOR® Reports. All comparisons reflect September 2026 versus September 2025 or August 2026, as indicated.

 The data relating to real estate on this website comes in part from the MLS® Reciprocity program of either the Greater Vancouver REALTORS® (GVR), the Fraser Valley Real Estate Board (FVREB) or the Chilliwack and District Real Estate Board (CADREB). Real estate listings held by participating real estate firms are marked with the MLS® logo and detailed information about the listing includes the name of the listing agent. This representation is based in whole or part on data generated by either the GVR, the FVREB or the CADREB which assumes no responsibility for its accuracy. The materials contained on this page may not be reproduced without the express written consent of either the GVR, the FVREB or the CADREB.