RSS

Market shifting in buyers’ favour, though hesitation remains

There were 5,723 detached, attached and apartment properties newly listed for sale on the MLS® in Metro Vancouver in June 2024. This represents a 7 per cent increase compared to the 5,347 properties listed in June 2023. This total is 3 per cent above the 10-year seasonal average (5,554).

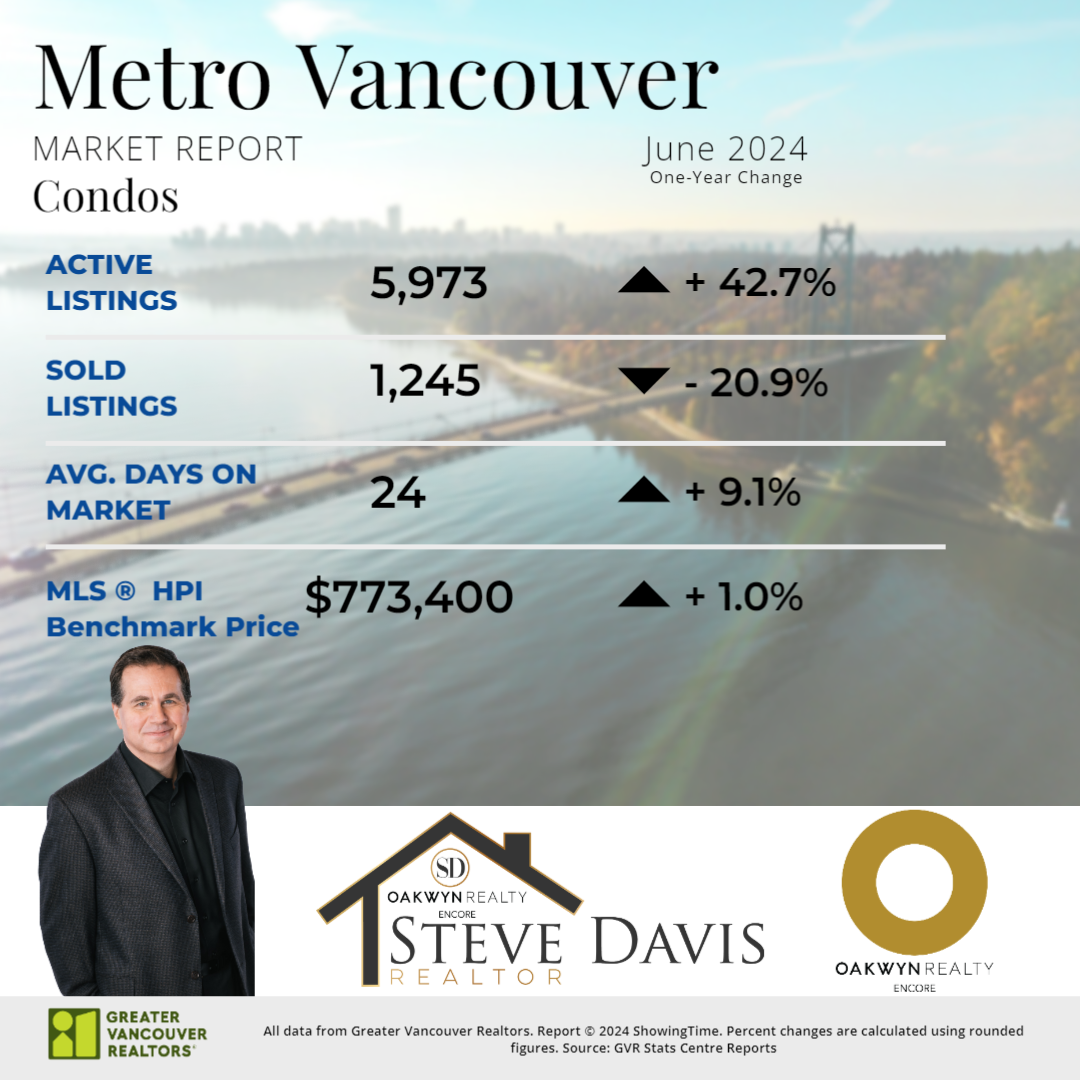
The total number of properties currently listed for sale on the MLS® system in Metro Vancouver is 14,182, a 42 per cent increase compared to June 2023 (9,990). This total is 20.3 per cent above the 10-year seasonal average (11,790).

Across all detached, attached and apartment property types, the sales-to-active listings ratio for June 2024 is 17.6 per cent. By property type, the ratio is 13.1 per cent for detached homes, 21.1 per cent for attached, and 20.3 per cent for apartments.

Analysis of the historical data suggests downward pressure on home prices occurs when the ratio dips below 12 per cent for a sustained period, while home prices often experience upward pressure when it surpasses 20 per cent over several months.

Read

Market Summary for June 2024

Metro Vancouver home sales registered on the MLS® remained below seasonal and historical averages in June. With reduced competition among buyers, inventory has continued to accumulate to levels not seen since the spring of 2019.

The Greater Vancouver REALTORS® (GVR) reports that residential sales in the region totalled 2,418 in June 2024, a 19.1 per cent decrease from the 2,988 sales recorded in June 2023. This was 23.6 per cent below the 10-year seasonal average (3,166).

Read
Reciprocity Logo The data relating to real estate on this website comes in part from the MLS® Reciprocity program of either the Greater Vancouver REALTORS® (GVR), the Fraser Valley Real Estate Board (FVREB) or the Chilliwack and District Real Estate Board (CADREB). Real estate listings held by participating real estate firms are marked with the MLS® logo and detailed information about the listing includes the name of the listing agent. This representation is based in whole or part on data generated by either the GVR, the FVREB or the CADREB which assumes no responsibility for its accuracy. The materials contained on this page may not be reproduced without the express written consent of either the GVR, the FVREB or the CADREB.